Inverse U.S. long-term bond-linked ETFs TBF and TMV explained!
Hi, Cantom here.
This article describes TBF and TMV, inverse-type U.S. long-term bond-linked ETFs. Unlike regular issues, inverse-type instruments are where the price of the base instrument rises when the cost falls rather than the other way around. Although they are inverse-correlated issues, they are not margin traded, so there is no risk of a blue sky loss if your prediction is off, as is the case with short-selling stocks.

Please refer to this article for information on TLT and TMF, the standard bull U.S. long-term bond-linked ETFs.
Contents
What are the advantages of inverse U.S. long-term bond-linked ETFs?
Since they are the reverse versions of TLT and TMV, they have many similarities, but they generally offer the following advantages.
- Government bonds are the most informative investment instrument
- You will understand economic cycles
- You will understand the impact of interest rates on stocks and exchange rates.
- The moderate volatility makes it difficult for beginners to make a big mistake.
- Prices often rise in tandem with the inflation rate, making them easy to use for short-term trades using economic indicators.
About TBF
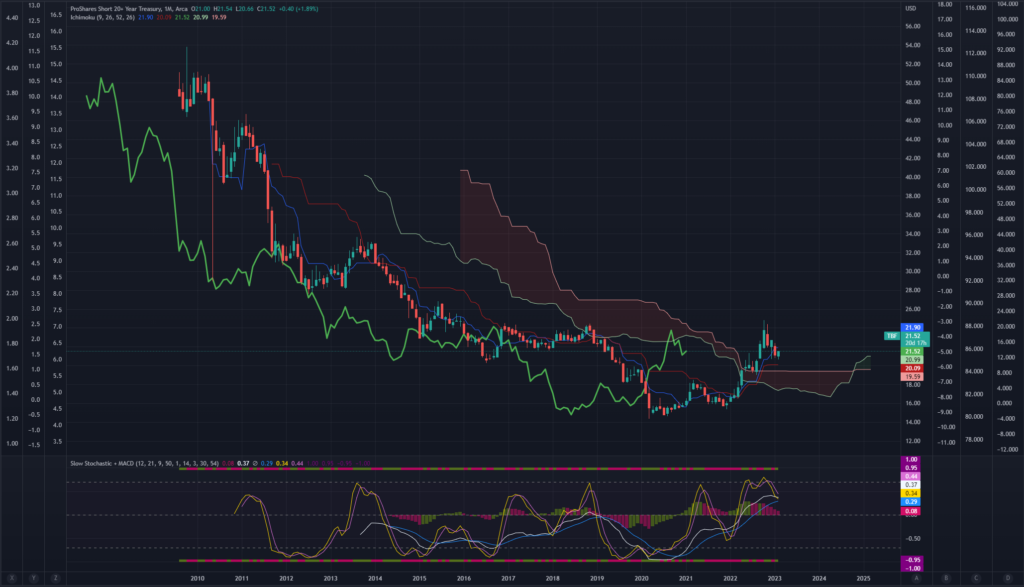
Officially, the product is designed to reflect the daily price changes of the ICE U.S. Treasury 20+ year bond in the negative direction by a factor of 1 (before expenses). As an investor, you can make an investment decision considering that the TBF is linked to the 30-year Treasury note, but note that the price of the TBF will rise when interest rates rise, and bond prices fall. It is better to use it for swing trading during increasing interest rates.
| Name | Short 20+ Year Treasury |
| Ticker | TBF |
| Managed by | ProShares |
| Management fee | 0.90% |
| Holdings | U.S. 20+ Year Notes (omitted due to plurality) |
| Official website | https://www.proshares.com/our-etfs/leveraged-and-inverse/tbf |
About TMV
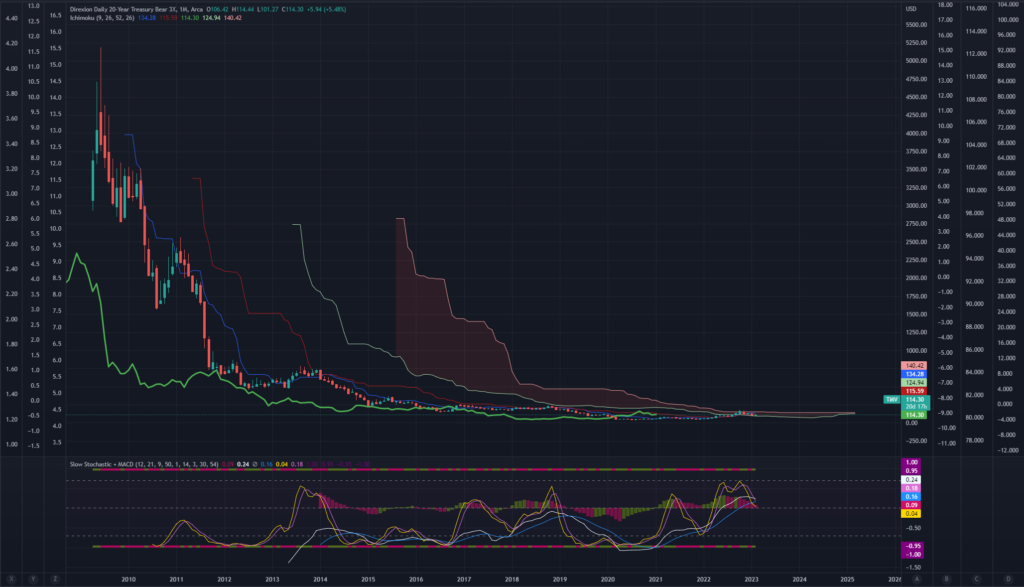
This ETF is managed by Direxion, the same company that manages TMF. Like TMF, it is described as an inverse ETF that aims to convert daily price fluctuations of ICE U.S. Treasury 20+ year bonds into negative 3x (before expenses). In principle, this is a product suitable for day trading. From an investor’s perspective, there should be no significant problems if the product is perceived as a TBF with 3x leverage. It is important to note that this 3x movement is a target value and is calculated daily, so if the product is held for an extended period, the volatility will not simply be 3x that of TBF. As you can see from the chart, it is better to recognize that this type of product will surely lose if held for a long time.
| Name | Direxion Daily 20+ Year Treasury Bear 3X Shares |
| Ticker | TMV |
| Managed by | Direxion |
| Management fee | 0.93% |
| Holdings | U.S. Treasuries 27-30: 42.28% 24-27: 31.50% 20-24: 26.20% |
| Official website | https://www.direxion.com/product/daily-20-year-treasury-bull-bear-3x-etfs |
Conclusion
It is a bit more advanced product than TLT and TMF, but once you can get on board with bull fixed-income ETFs, it would be interesting to include it in your trade candidates. Even looking at the chart without actually trading may give you trade ideas for correlated issues. On a related note, you may find the article “Interest Rates (1): Long-Term Interest Rates and Bond Price Fluctuations” helpful regarding investment timing for bull-type ETFs linked to long-term U.S. Treasury bonds. Please read this article for a logical image of long-term bond price movements.
I hope you find it useful.
