
Contents
Last Week’s Summary: US Treasury bonds Up, US stocks Steady, and Crude oil Up
Hello, this is Cantom.
Last week, bonds and crude oil performed strongly, while stocks had a directionless week.
Summarizing the performance of major trading stocks, the results are as follows.
- TLT: 108.53 (+2.29%)
- TBF: 20.67 (-2.18%)
- S&P500: 4105.03 (-0.10%)
- NDQ : 13062.60 (-0.90%)
- WTI : 80.70(+6.29%)
- DXY: 102.10 (+0.00%)
- USD/JPY: 132.16(-0.45%)
The better-than-expected unemployment rate on Friday helped put a stop to the decline in interest rates due to recession fears in the market. However, it can also be said that this was a technically predictable move. I will explain this in more detail through an analysis of the 30-year bond yield.

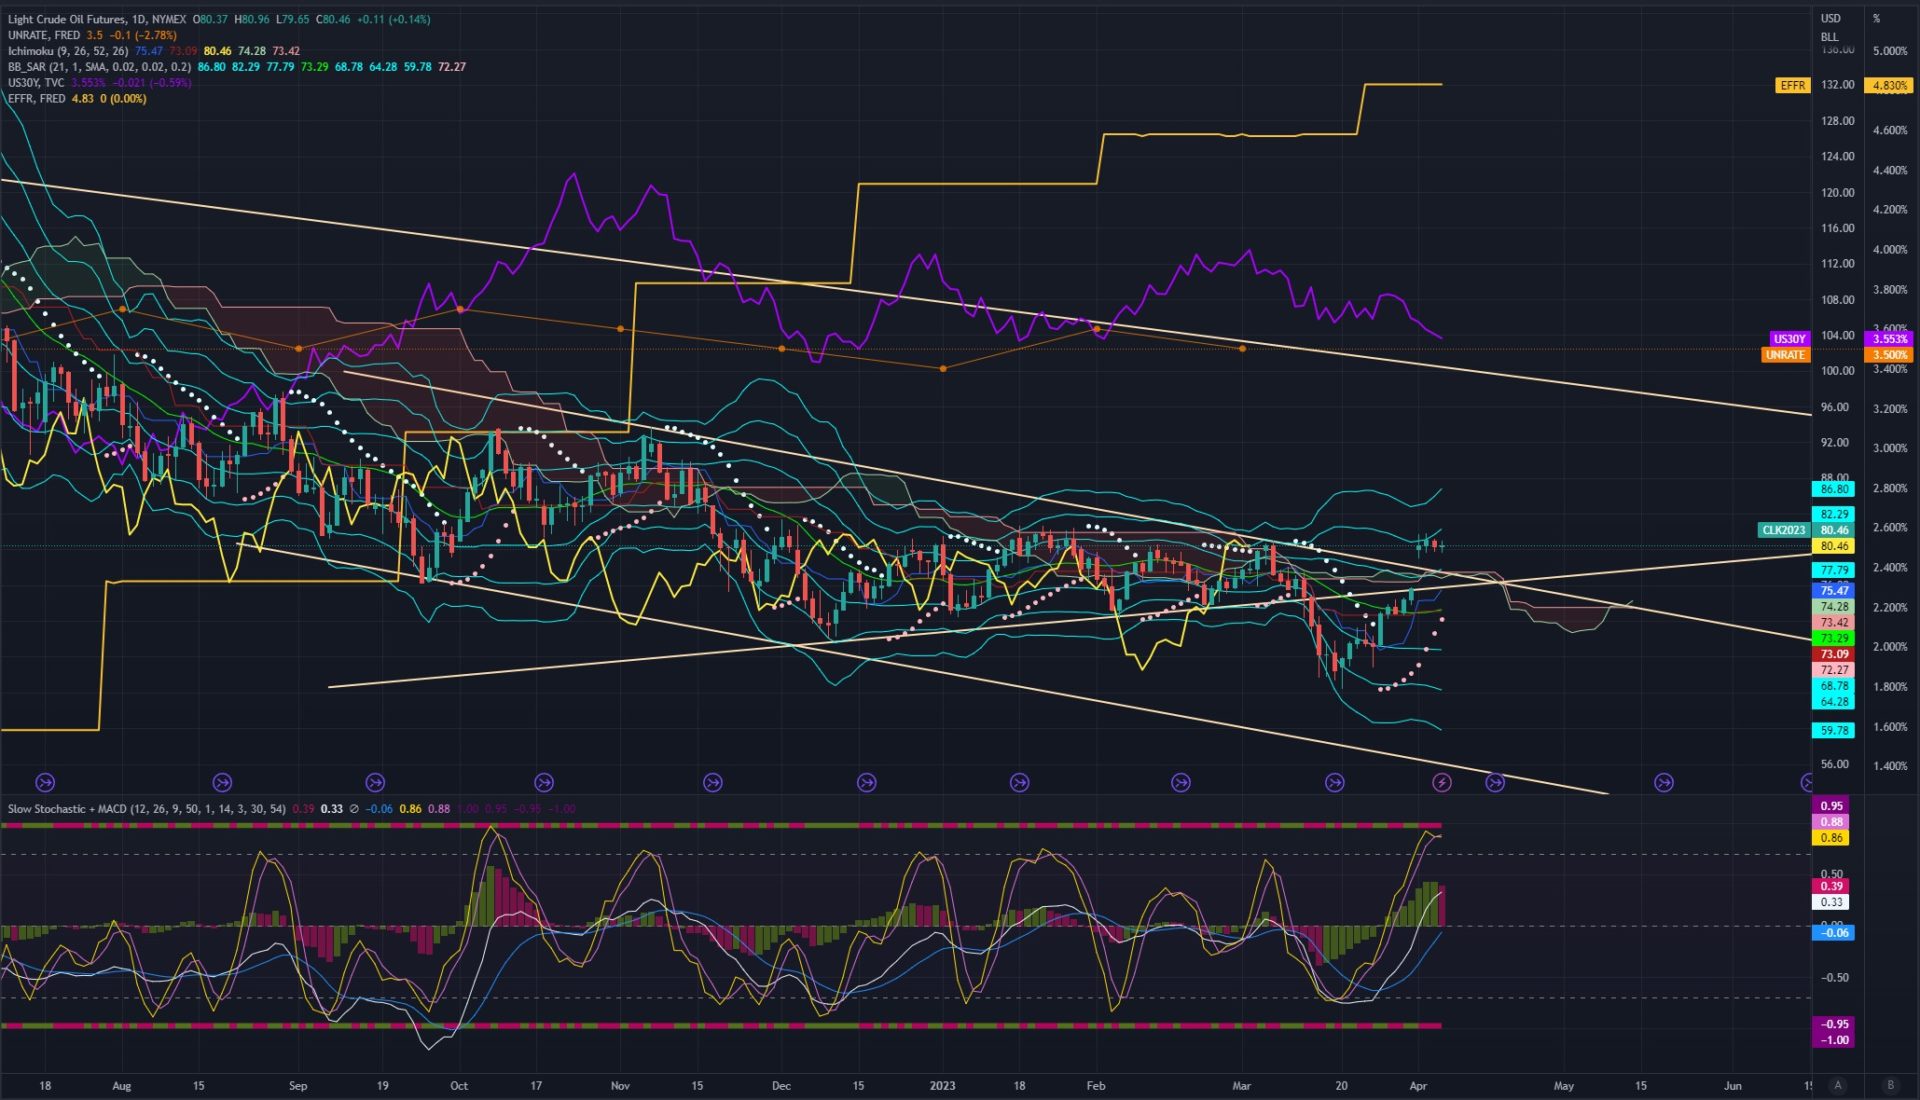
The news of OPEC+ production cuts caused a surge in crude oil prices. It was determined that the medium-term downward trend in crude oil prices had been canceled.
Long-Term Perspective and Strategy
As of April 7, there is a change in outlook regarding crude oil.
We continue to maintain our long-term stance that the Fed’s interest rate hikes are coming to an end, and now is a good time to actively consider investing in US bonds.
In the medium term, we see the overall stock market continuing a gradual uptrend or forming a range, and we anticipate a full-fledged crash resuming around the time when the Fed begins to consider monetary tightening, likely in the latter half of 2023 to early 2024. The negative impact of a rapid monetary tightening will undoubtedly be felt.
We believe that central banks around the world have underestimated their influence. The high inflation rates since the outbreak of the pandemic have been largely influenced by unprecedented monetary easing, and the current interest rate hikes and QT are processes aimed at correcting this mistake. We think that repeating the same mistake with an opposite policy of rapid tightening is likely to occur this time.
We also consider the possibility of bringing forward our scenario depending on the progress of the banking crisis starting from March 2023.
If we assume that the pattern will be the same as the past several decades, we believe that phenomena such as a collapse in commodity prices, a stock market crash, and a surge in the VIX will begin to occur around the time when interest rate cuts are approaching. In this phase, there is a possibility of making huge profits in a short period of time with inverse commodities. In 2023, focus on bond investments and reduce overall positions to prepare for opportunities. (If you do not engage in inverse trading, bonds will serve as a strong risk hedge.)
- The timing for purchasing bond ETFs is explained in this article.
We had assumed that crude oil would move within a certain range, but the technical level was broken due to OPEC+ production cuts. As there is resistance around 82, we believe that there is a high possibility of a rebound at this level, but attention should be paid to whether it will surpass this level or not.
Short-Term Perspective and Strategy
Now let’s explore if there are any short-term opportunities this week.
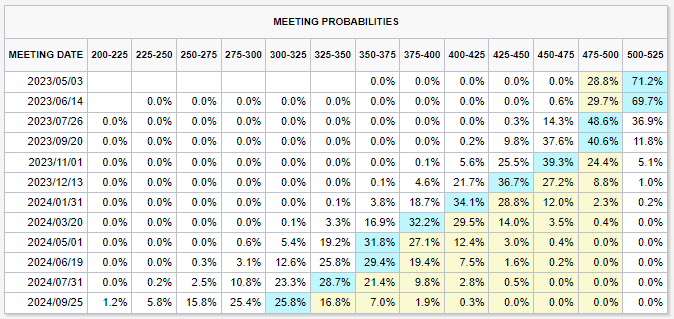
Major economic indicators
Key Points
Personally, I am paying attention to the CPIYOY announcement on April 12th.
The market expectation is 5.2%, but if the number is higher than expected, it is likely that interest rates will accelerate their rise. As the unemployment rate and inflation rate have a strong inverse correlation, it would not be surprising if the trend from last week continues. Unless there is a significant surprise, I believe that it will not be possible to continue the trend of declining interest rates from the previous week.
Key Fundamentals
As mentioned in this article, if we apply the same pattern as in the past, interest rate hikes will not end until the value obtained by subtracting the “one-month short-term bond yield” from “CPIYOY” becomes around minus 1. However, if we assume that the hike has ended with last week’s increase, it will not be realized unless CPIYOY records 4.0% or below. Additionally, it appears that the Fed is temporarily ensuring liquidity in response to the banking crisis, but I think this poses a high risk of becoming a concern for future inflation. They may continue to tighten by resuming QT in the future.
It is dangerous to assume that the Fed will easily loosen its grip on inflation given the low unemployment rate of 3.5% in the US.
At this pace, there may be talks about the possibility of additional interest rate hikes until around June.
Technical Analysis
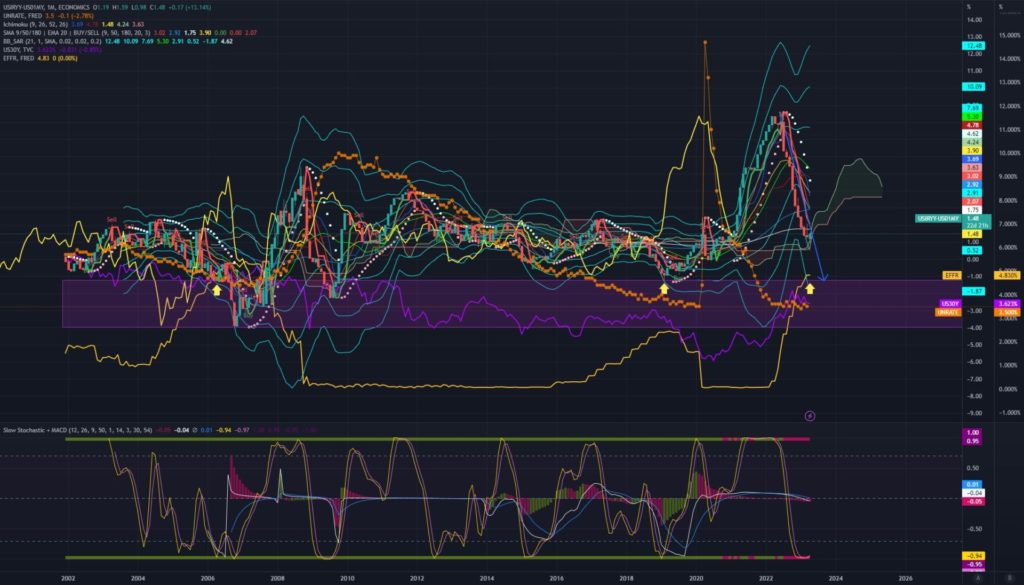
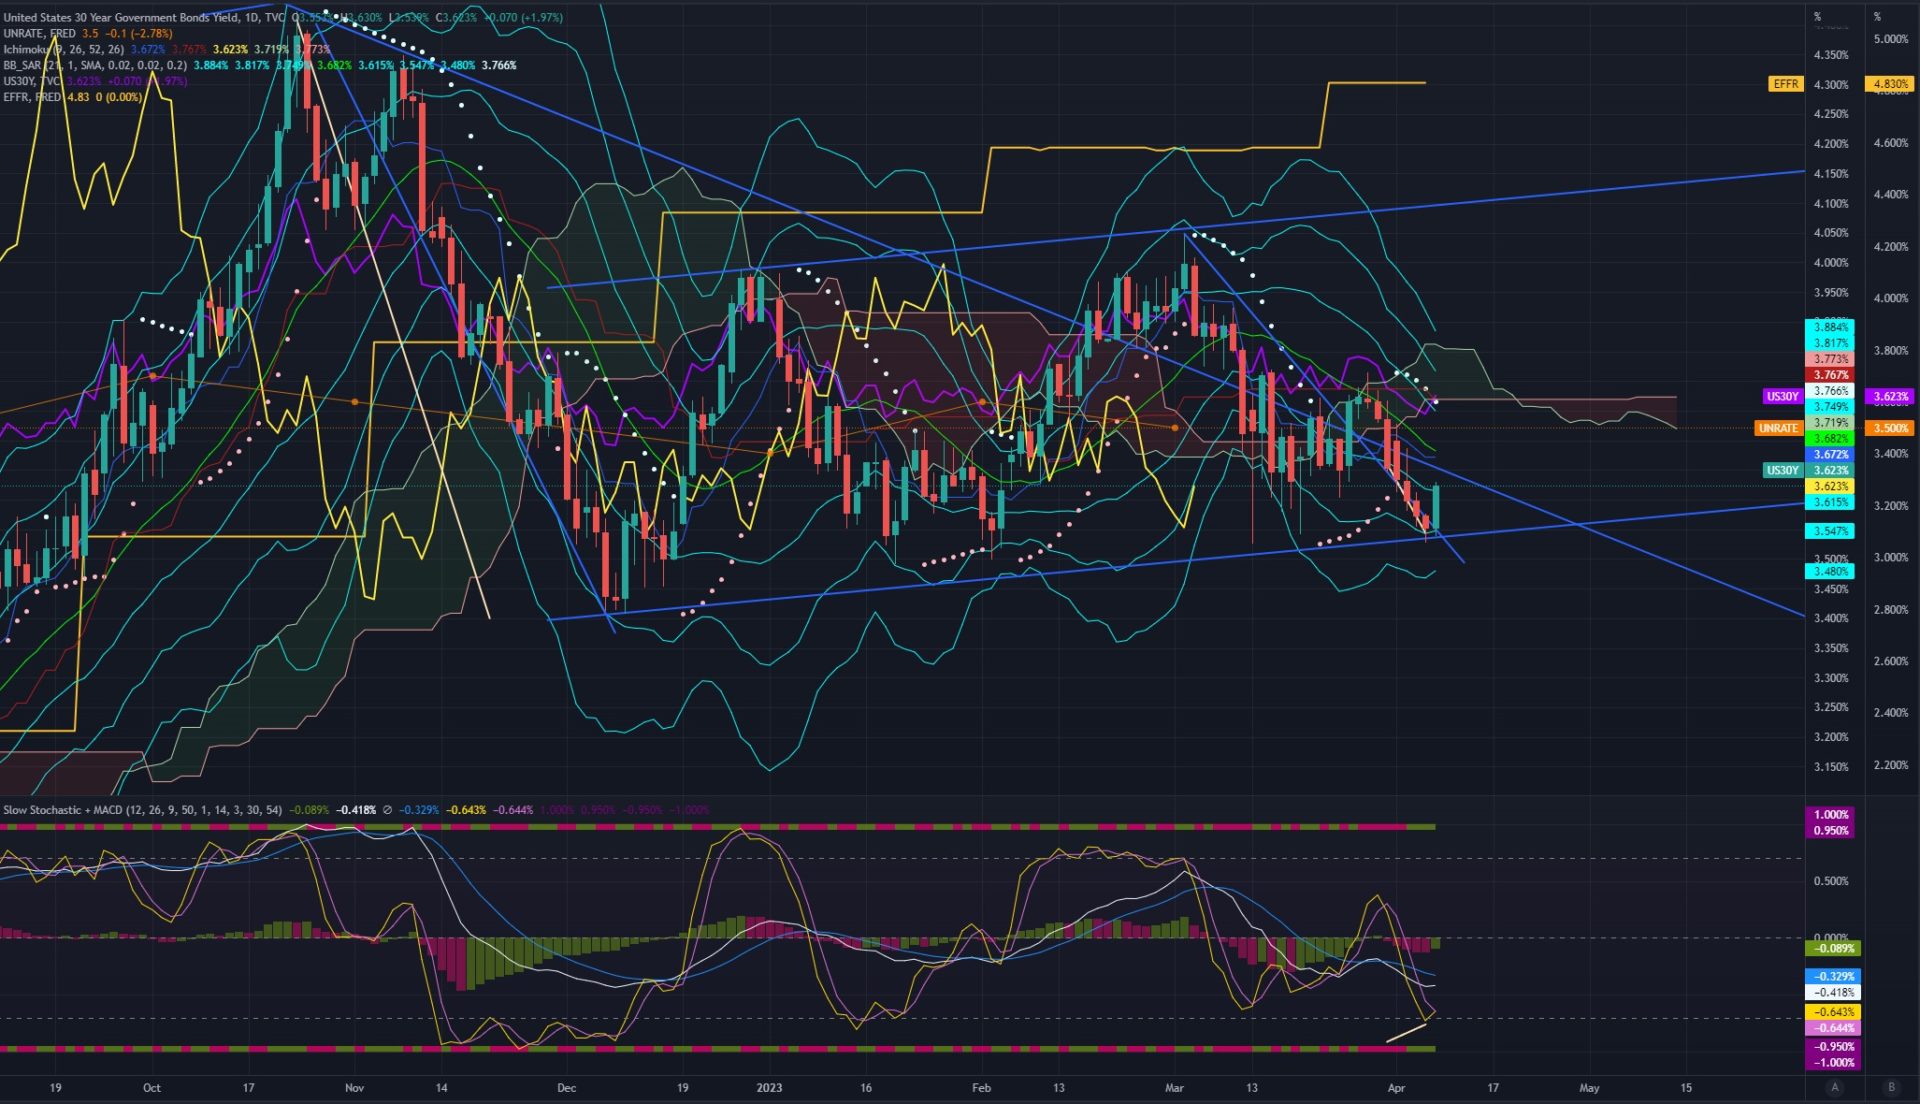
US 30-year bond yield
This is the daily chart. The trend of declining interest rates was reversed due to the unemployment rate announced on Friday being lower than expected. For the time being, the focus will be on how far the interest rate rise will continue. If you want to use this trend for short-term trading, TMV seems to be a good choice, but it is important to remember that the CPI will be announced on the 12th.
If the inflation rate is significantly slowing down compared to market expectations, it is possible to break the lower limit of the bear flag at once. In the short term, it may be a good idea to assume that interest rates will rise to around 3.75%. On the other hand, if the inflation rate remains high, there is a possibility that the uptrend will develop up to around 3.9%.
It was confirmed this week that the interest rate rebounded at the lower limit of the bear flag. Technically, this can be explained on the chart, and there was also divergence on the 4-hour chart. That’s why I tweeted that we shouldn’t be too bullish and aggressive.
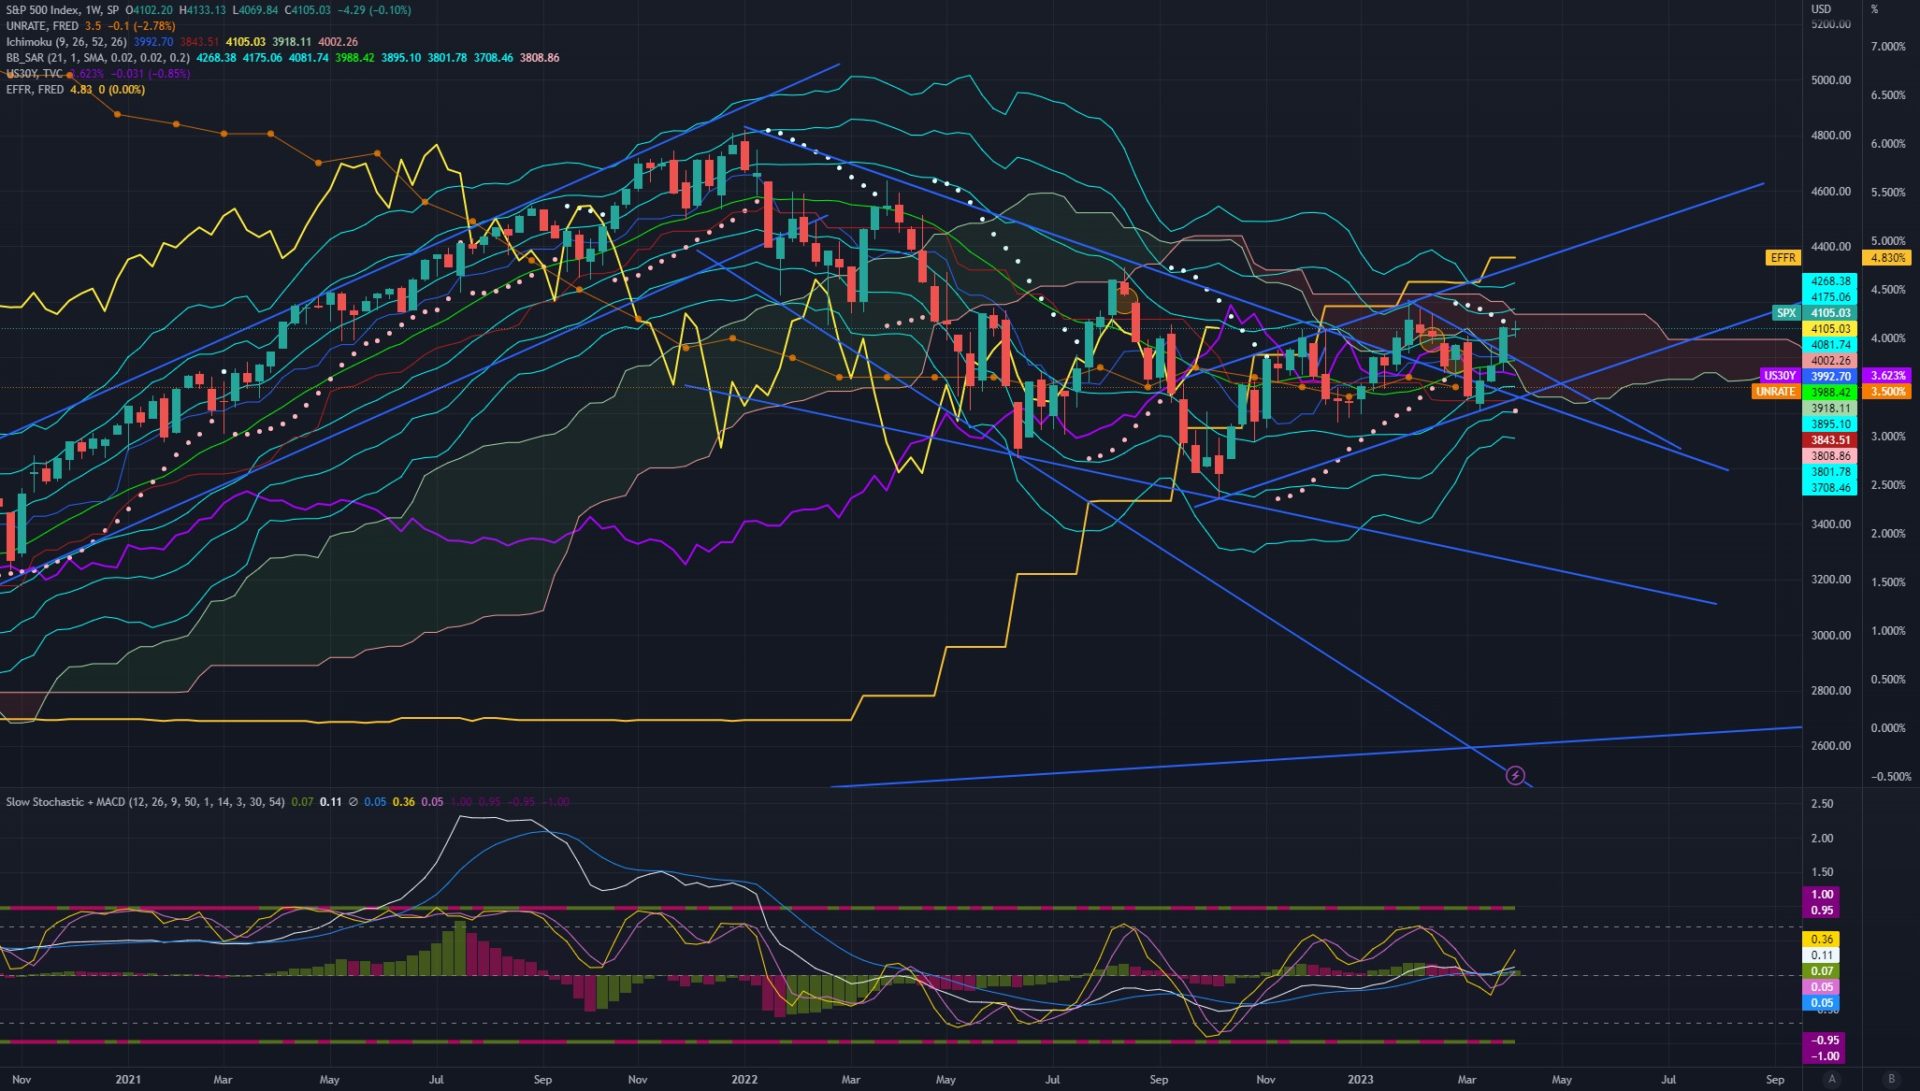
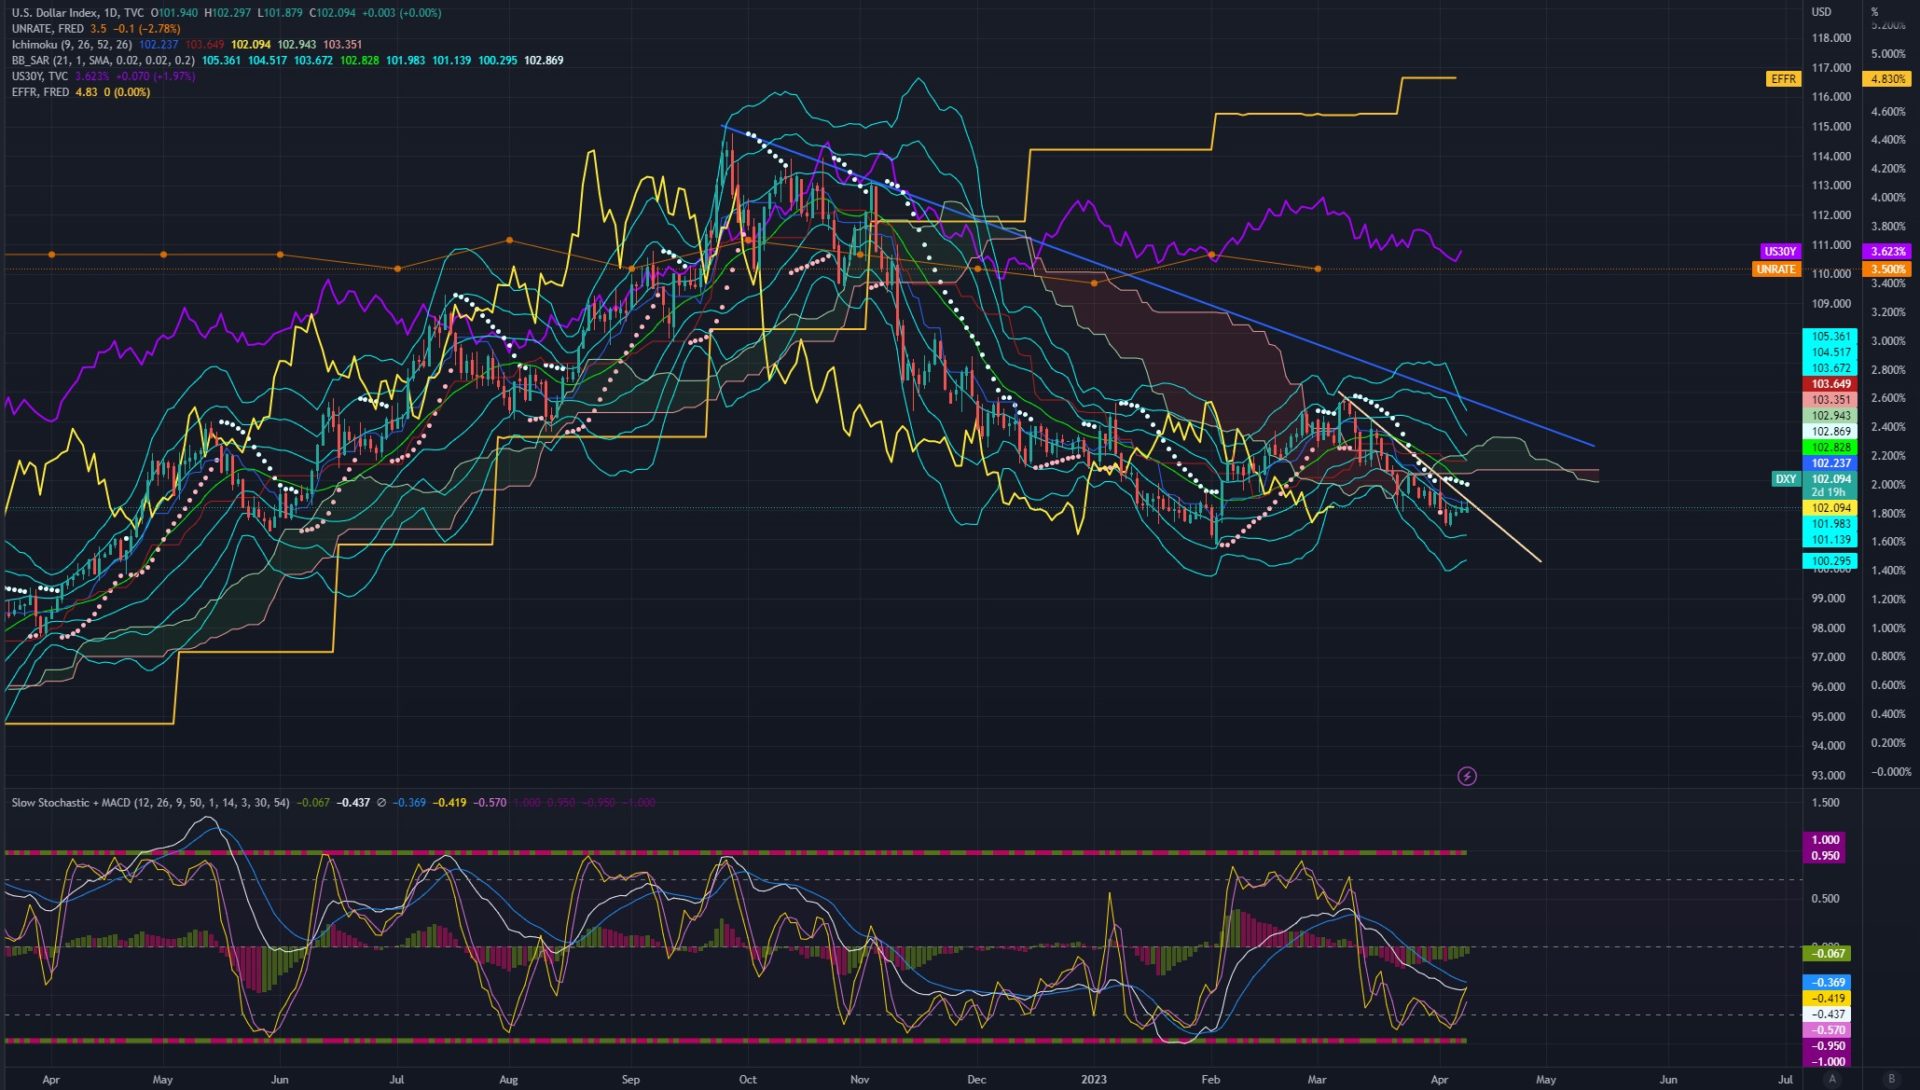
S&P500
This is the weekly chart. There is no major difference in the overall perception of the environment compared to last week. It is possible that the upward trend has reversed by breaking through the resistance line on a weekly basis, but it may be too early to be complacent as there is also a possibility of forming a head and shoulders pattern. Since rising interest rates put downward pressure on stock prices, even if there is a rising trend due to the low unemployment rate this time, I think it will be a small move. If you want to follow the bull trend, you should be cautious. Personally, like last week, it seems that the bond market offers a better risk and return environment.
I also mix index investments with dollar cost averaging for my long-term strategy, but I recognize that it will be difficult to enter short-term trades next week as well, especially if there is an interest rate hike. Even if stock prices rise, the movement is likely to be sluggish.
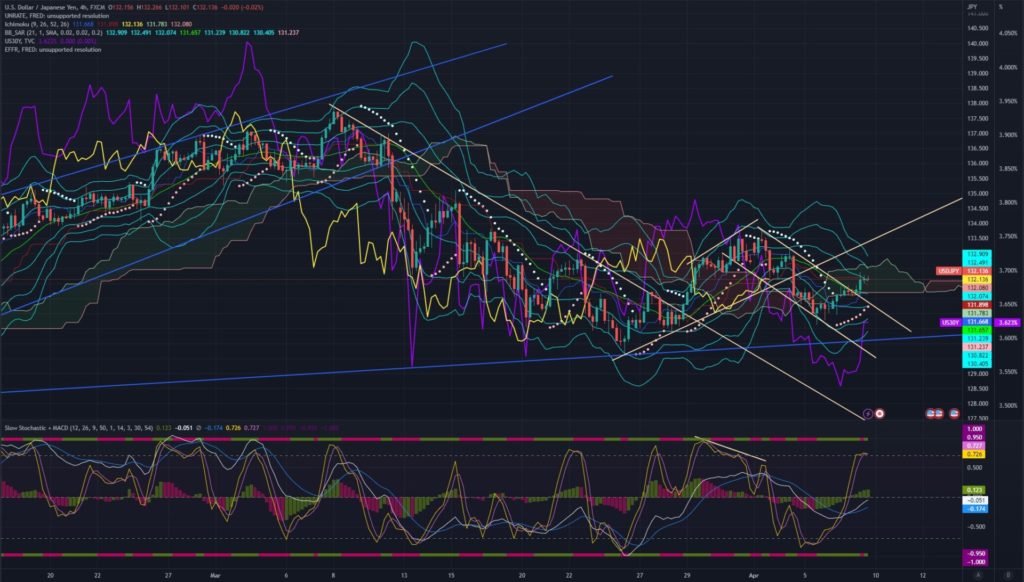
USD/JPY
This is the 4-hour chart. Last week, there was a slight yen strengthening movement as we had anticipated. While a yen weakness trend is expected to develop against the backdrop of rising interest rates, we need to confirm the trend reversal of the Dollar Index (DXY) as a prerequisite condition. Since the US is approaching the end of its rate hikes, there is not much room for the widening of the interest rate spread between the short- to medium-term bonds of Japan and the US. If you want to bet on a yen weakness, it would be safer to enter after confirming the trend reversal of DXY, but a yen weakness is likely to be short-lived, so it may be a good strategy to take small profits. The level of 133.5 yen or higher depends on the results of the CPI.
Looking a bit further ahead, there is no change in the main scenario of a yen appreciation.
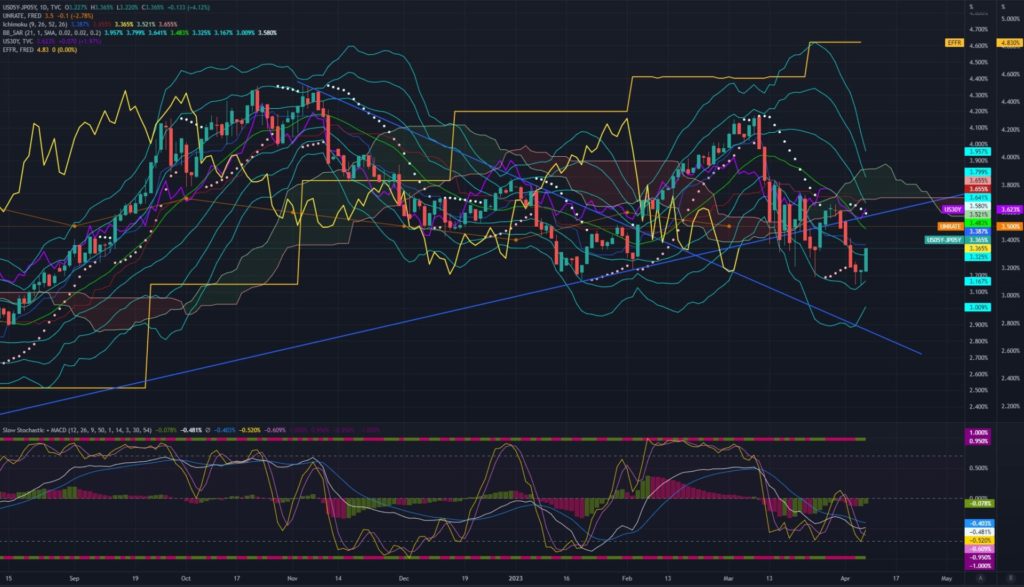
Japan-US 5-year bond yield spread
This is a daily chart. There have been no significant changes in the outlook, and it is highly likely that the trend has reversed due to the shrinking of the yield spread between Japan and the United States. As before, the key will be the “FRB’s expected end of interest rate hikes” or “the Bank of Japan’s expected start of monetary tightening,” but I believe that the recent banking crisis has led to the completion of a scenario where “financial crisis > FRB policy shift” is associated.
Based on the larger trend, it’s currently seen as a small wave within the overall trend of a strengthening yen. Although it would be natural to take a bullish stance on the weak yen after the CPI results, it’s important to keep in mind that this would be a small fluctuation within the overall trend. In Japan, there has also been talking of a tax increase, which could have a tightening effect on the financial market. It’s probably best not to have excessive expectations for a weakening yen trend.
Crude Oil
This is a daily chart. The OPEC+ decision to reduce production completely destroyed the chart and scenario. It is necessary to switch based on the information at hand. For now, the medium-term downtrend has ended, but I don’t expect it to continue rising rapidly. With the window open and the Stochastic in a high area, I imagine a pullback to around 73 before forming an inverse head and shoulders.
The decision by OPEC+ to cut production has put crude oil back in a state of backwardation. It’s time to start over and adjust the strategies accordingly.
Conclusion
I do not plan on taking aggressive positions until I see the CPI results, but short-term trading using the momentum from the unemployment rate is promising until the CPI announcement. It’s important not to take speculative positions without considering the data. Next week, I’d like to continue trading with favorable stocks.
I hope this information is helpful.
