
Contents
Last Week’s Summary: Balanced US Treasuries, Rising US Stocks, and Oil Prices
Hello, this is Cantom.
Last week, the bond market was balanced, while stocks and oil had a strong week.
Here are the results for some of the major trading stocks:
- TLT: 106.85 (+0.00%)
- TBF: 21.03 (-0.85%)
- S&P500: 3970.98 (+1.39%)
- NDQ: 12767.05 (+1.97%)
- WTI: 69.26 (+4.01%)
- DXY: 103.12 (-0.72%)
- USD/JPY: 130.71 (-0.85%)
After the FOMC raised interest rates by 25bps, the stock market soared. However, after the statement included hawkish comments, the stock market plummeted. Nonetheless, the market was very volatile, rebounding towards the end of the week. It was a week that showed the importance of having the courage not to enter the market during such significant events.

On the other hand, I was too busy with my main job and did not actively make any positions. However, as planned, when the crude oil price hit 71, I made a short-term trade using the crude oil bear ETF, SCO. This trade closed at a gain of around 8%, but due to the small position, the growth of my portfolio was only about 2%. It felt a bit of a shame since crude oil was down nicely during after-hours trading.
Long-Term Perspective and Strategy
As of March 24th, there have been no significant changes in the overall outlook. We continue to maintain our long-term stance that the end of the Federal Reserve Bank’s interest rate hikes is near, and it may be time to consider investing in US bonds.
In the medium term, we expect the overall stock market to continue to experience gradual growth or range-bound trading and anticipate a significant crash to resume when the Federal Reserve Bank begins to consider monetary tightening. We anticipate this crash will likely occur in the latter half of 2023 to the early part of 2024. The negative impact of a sudden monetary tightening will undoubtedly be evident.
We believe that central banks around the world have underestimated their own influence. The high inflation rates since the COVID-19 pandemic are largely due to the significant impact of unprecedented monetary easing, and the current interest rate hikes and quantitative tightening (QT) are processes aimed at correcting this mistake. We think that if there is a sudden policy reversal in the form of significant monetary tightening, the same mistake will be repeated.
We also believe that depending on the progress of the banking crisis from March 2023, there may be a scenario where our predictions are brought forward.
If we assume that the same pattern will follow as in previous decades after this rate hike, we believe that resource prices will collapse, there will be a stock market crash, and a surge in the VIX will occur when the time for interest rate cuts approaches. During this phase, there is a potential for substantial profits to be made in inverse commodities trading. In 2023, we recommend constructing a portfolio centered around bond securities, lightening the overall position, and being prepared for opportunities. (If not engaging in inverse trading, bonds can serve as a powerful risk hedge.)
We explain the timing of purchasing bond ETFs in this article.
Crude oil has finally broken through the range of 82-72 that it had maintained from the end of December to mid-March. This is a significant development that has broken the monthly range level. We anticipate that crude oil may fall below 50 dollars from late spring to early summer as the main scenario.
Short-Term Perspective and Strategy
Now, let’s explore any short-term opportunities for this week.
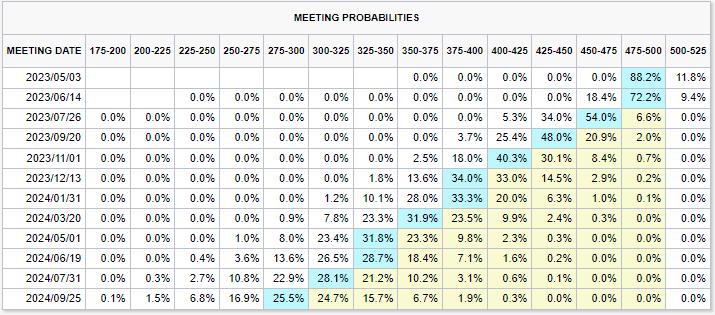
Major economic indicators
Key Points
Personally, I am paying attention to the unemployment insurance claims and GDP-related indicators to be released on March 30th.
I do not think that the data currently available is too bad, but it is difficult to judge until we see the actual numbers. If positive figures emerge, I expect there will be a more conscious tightening of monetary policy.
Key Fundamentals
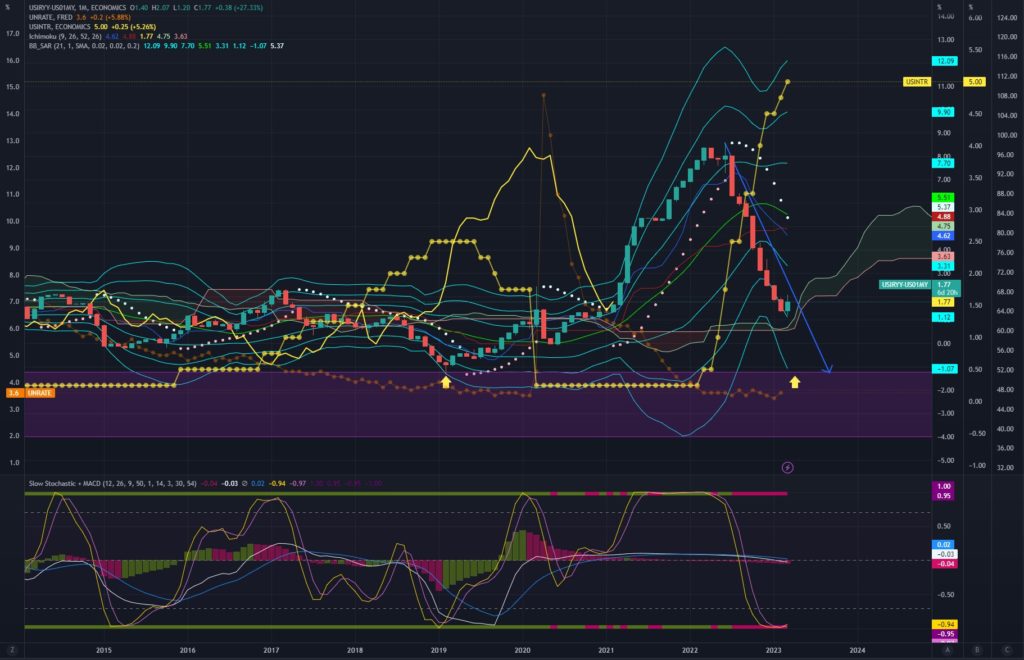
As mentioned in this article, if we apply the same pattern as in the past, we assume that interest rate hikes will not end until the value obtained by subtracting “one-month short-term bond interest rates” from “CPIYOY” becomes negative 1. However, if we assume that the rate hike ended with last week’s hike, “CPIYOY” must not record below 4.0% to be realized. Additionally, while the Federal Reserve Bank appears to be temporarily securing liquidity in response to the banking crisis, this may become a concern for inflation in the future. It is possible that they may continue to tighten by restarting quantitative tightening (QT) at some point.
The US unemployment rate is still low at 3.6%, so it may be dangerous to assume that the Federal Reserve Bank will easily ease the inflation-crushing policy.
Technical Analysis
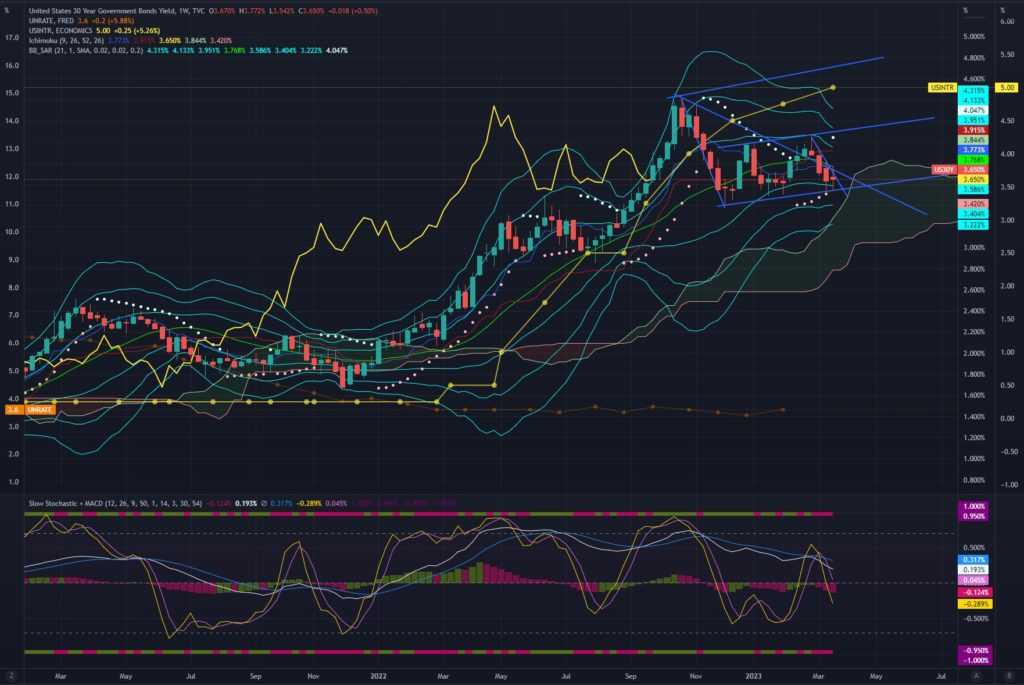
US 30-year bond yield
This is a weekly chart. It was once again rejected at the resistance level of the lower limit of the range. We recognize that a bear flag is being formed, but the fact that it was rejected this week suggests that we should be wary of a further rebound in interest rates. We believe that breaking the lower limit is only a matter of time, but there is a risk of being rebounded significantly once. If you want to take action, we think it would be better to use the US bond bear ETFs TBF or TMV. However, if you want to attack with a US bond bull, it is safer to wait for the break of the lower limit of the range or a trend reversal within the range. If we confirm a downward break, it will become easier to attack toward 3% or below.
If interest rates rise from here, it could have a negative impact on stock prices.
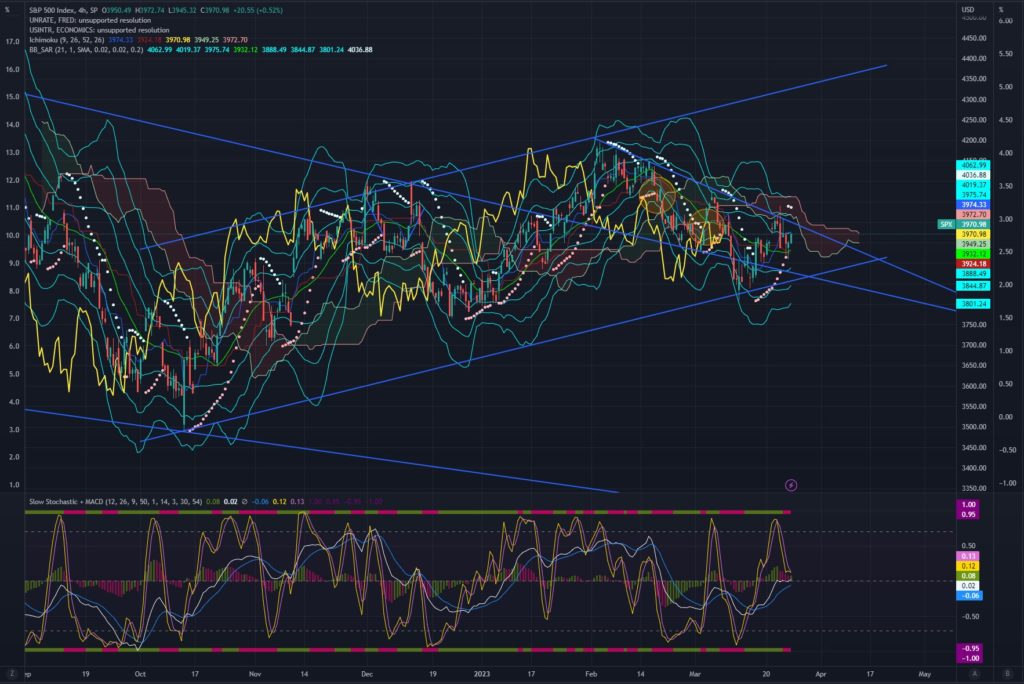
S&P500
This is a 4-hour chart. Last week, it showed a volatile movement up and down between 3901 and 4039. It is difficult to predict the future, but this movement is understandable considering the unclear direction of interest rates. As I can see the possibility of an interest rate rebound, I remain bearish. If an interest rate rebound occurs, a decline to 3500-3600 wouldn’t be surprising.
If the risk-off continues due to the bank crisis, it would be an exception, but generally speaking, a rise in interest rates leads to a decline in stock prices, while a fall in interest rates tends to result in a rise in stock prices, as per the theory. The situation is very uncertain.
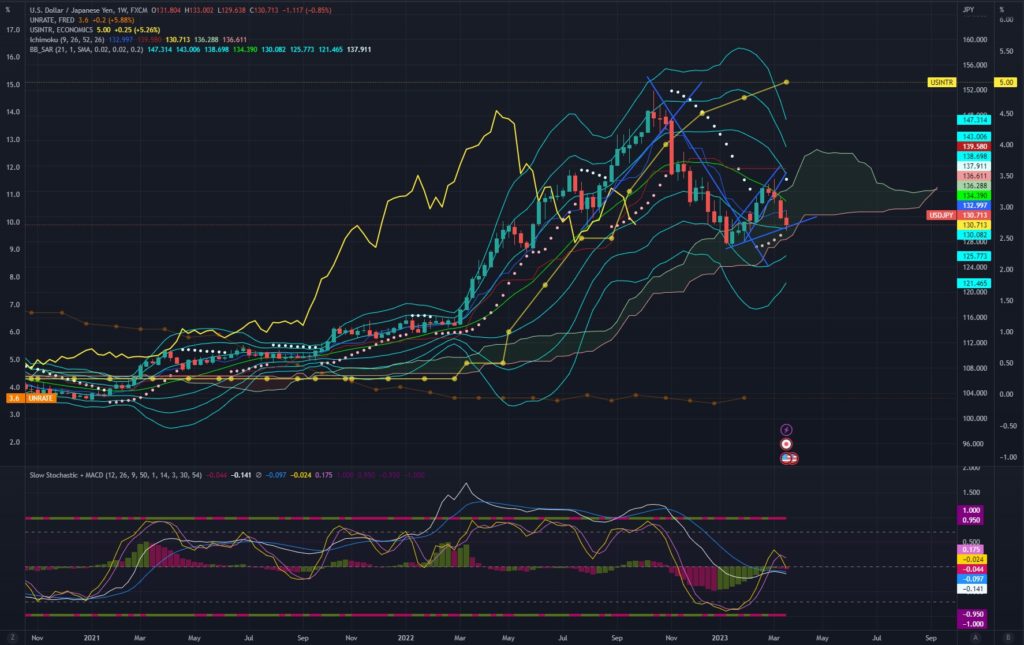
USD/JPY
The weekly chart of USD/JPY is shown here. As analyzed last week, the pair dropped after hovering around 130.5 yen. The support line was broken, and the narrowing of the yield spread between short- and medium-term bonds continued, leading to a stronger yen. However, I still feel uncertain about the direction of the long-term bond yields, which also adds to the ambiguity of the direction of the medium-term bond yields.
Next week, it is important to consider the possibility of the direction remaining uncertain, or the confirmation of the bottoming out of a short-term trend. For the short term, unless a yen appreciation factor emerges from Japan or a renewed risk-off sentiment emerges, I don’t plan to enter short in USD/JPY. I made a yen appreciation call at around 136 yen, which has brought a profit of around 500 pips over three weeks. Until the next trend becomes clear, there is no need to be greedy.
In the longer term, the main scenario remains for a stronger yen.
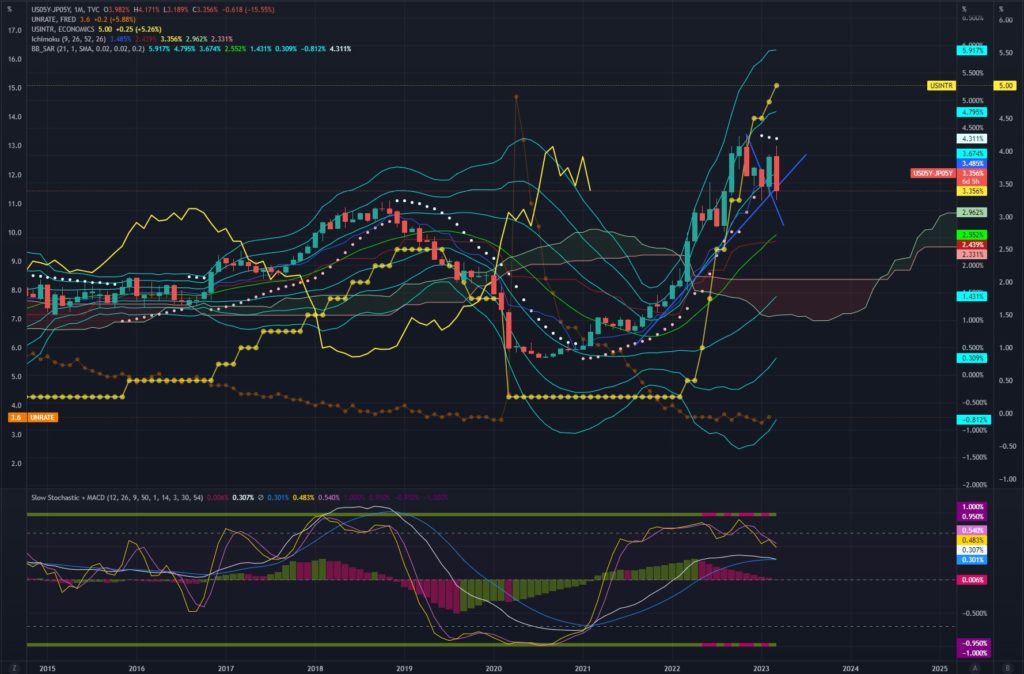
Japan-US 5-year bond yield spread
This is a monthly chart. I believe there is a high possibility that the trend of the shrinkage of the Japan-US interest rate differential has reversed. As usual, “the Federal Reserve Board’s forecast of the end of policy interest rate hikes” or “the Bank of Japan’s forecast of the start of monetary tightening” will be key factors, but I believe that the recent banking crisis has completed a scenario where “financial crisis> FRB policy shift” is associated. On the other hand, the market feels like it has priced in too much monetary easing. If a strong stance against inflation is shown at the FOMC, there is a high possibility that the interest rate trend will become volatile.
The long-term outlook has not changed, but I think there may be a slight correction towards the end of the month and into early April. If the interest rate differential returns to a level above 3.65%, it may be worth considering shorting the USD/JPY while consulting with the chart (currently at 3.356%).
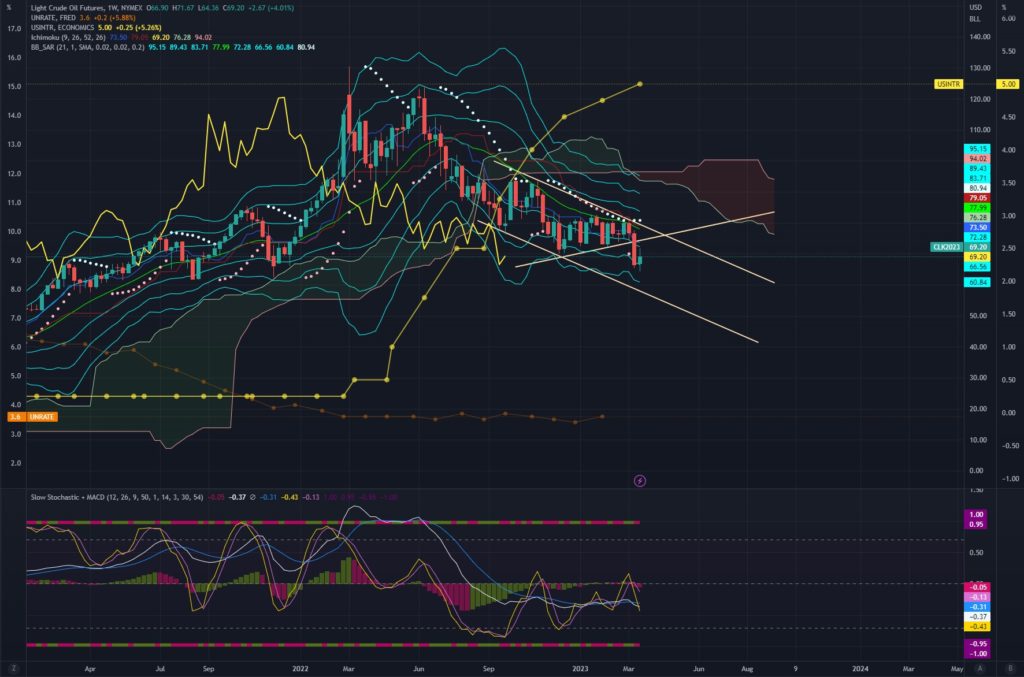
Crude Oil
Weekly chart. Last week, the price rose to 71.67, which matched the previous analysis of a potential rise to around 72. Although I believe the overall trend is bearish, there is a possibility of testing the upper limit of the band shown on the chart. If the price rises to around 75, I will consider shorting.
I believe there is significant energy built up in the market. My main scenario for the medium-term is that crude oil will continue to decline below $50.
Regarding the analysis from the previous week, my call for a potential rise to around 72 was spot on. I have already taken profits from my short-term trades using SCO (around +8%), as I was aware of the possibility of a band walk as shown on the chart.
Conclusion
This week’s strategic policy remains largely unchanged from last week, with a focus on selling crude oil rallies. It is important to continue monitoring the direction of interest rates and trading in favorable stocks. I hope this information is helpful.
