
Last week’s summary: U.S. bonds down, U.S. stocks down, oil down
Hello, Cantom here.
Last week was generally weak for bonds, stocks, and oil.
The following is a summary of the significant issues traded.
- TLT : – 0.98%
- TBF: +1.14%
- SP500 : – 0.28%
- NDQ : + 0.43%
- WTI : – 4.01%
- USD/JPY: + 2.07%
The impact of rising interest rates and a stronger dollar continued to be a theme.

Cantom entered TMF’s concise term on the reverse side of last week’s long-term interest rate triangle rebound and lost money but then switched to TMV and entered a short-term trade in SPXU, ending the week at about +3%. All positions for swing have been closed, and I now have a bond ETF for long-term holding purposes and a crude oil bear ETF for theory testing.
Contents
Mid-Term and Long-Term Perspectives and Strategies
As of February 17, when the article was being written, there has been no change in the outlook.
We maintain our long-term stance that the end of the Fed’s interest rate hikes is near and that it is time to consider investing in U.S. bonds actively.
In the medium term, we expect the overall stock market to trend slowly higher or form a range, with a full-scale crash resuming when the Fed will likely begin to consider monetary easing. We assume that this will probably be in late 2023 or early 2024. The adverse effects of sharp monetary tightening will undoubtedly be felt.
The high inflation rate since the Corona disaster was mainly due to the effects of the extraordinary monetary easing. We believe that national central banks have underestimated their impact. The rate hikes and QT currently underway are a process to correct that mistake. I think the same error will be repeated this time with a reverse policy of sharp tightening.
If we believe that the pattern after this rate hike will be the same as the past few decades, we will start to see a collapse in the resource market, a stock market crash, and a VIX spike around the time the rate cut approaches. Inverse instruments could yield considerable gains in a short period during this phase, so for 2023, build around bond issues and keep your overall position light and ready for opportunities. (Bonds are a potent risk hedge if you don’t trade inverse.)
- 債券ETF購入のタイミングはこちらの記事で解説しています
It should be noted that the forward contract in the crude oil futures market is in contango. This suggests that the market has high expectations that future supply will exceed demand. Be careful, as this could accelerate the price decline of crude oil.
As for crude oil, rising long-term interest rates and a rising DXY (dollar index) are tailwinds. However, the contango has been contracting since Russia announced production cuts in the second week of February. Our long-term stance remains unchanged, but when trading crude oil in the current environment, it is safe to attack the market with a policy of selling the highs on the return. In the unlikely event of backwardation, it is safe not to force a short position in crude oil. Be aware that a weakening trend toward a stronger dollar could lead to a sharp rally.
Short-term perspective and strategy
So let’s continue to look for short-term opportunities this week.
Major Economic Indicators
Noteworthy Points
We are aware that there are not many major events this week.
I think it is better to focus on the technicals while paying attention to how long the momentum of rising interest rates in long-term bonds continues.
The S&P 500 and NASDAQ have been unable to fill the gap after opening a window and falling on Friday. It seems safe to confirm this window filling and then look at multiple hourly charts to see if the upward trend in interest rates and the downward trend in stock prices will continue.
Interest rates have spiked, so I wouldn’t be surprised to see them test the return a bit. At the end of the week, I think we will see interest rates fall and stock prices rise before returning to their original tone.
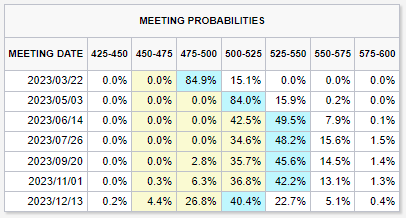
Featured Fundamental
As we pointed out last week, market expectations seem tilted toward further rate hikes. As I wrote in this article, if we follow the same pattern as in the past, a rate hike will not be completed until the CPIYOY minus the one-month Treasury bill rate is around minus 1, so even if another 75 bps rate hike is implemented, it will not be realized unless the CPIYOY is below 4.5%. This is a very tough target to achieve. This seems like a pretty tough target, so it seems reasonable to assume that the trend of rising interest rates will not end quickly.
Technicals
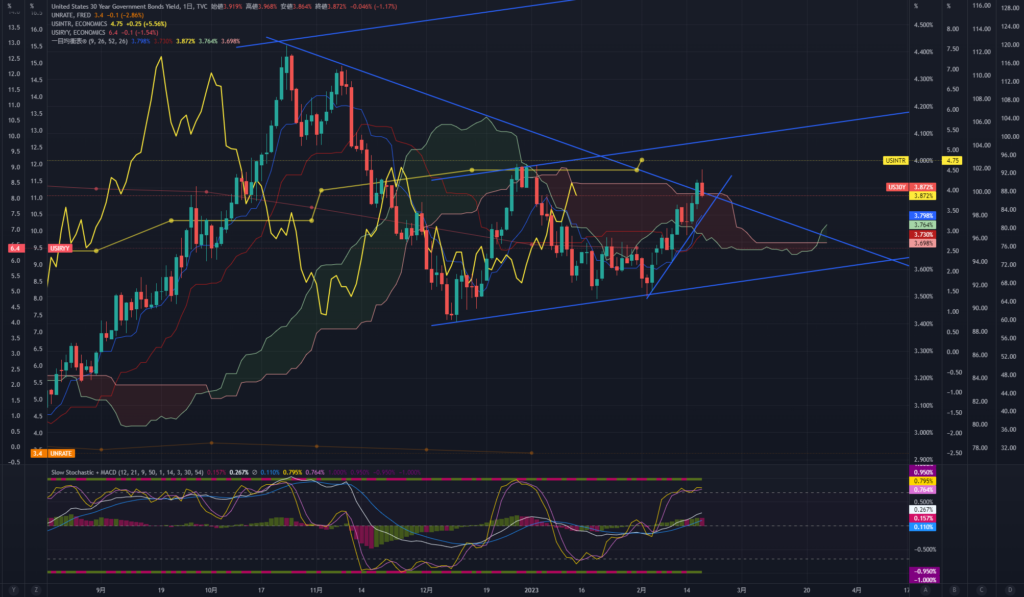
U.S. 30-year bond
This is a daily chart. Since the price has been going up unilaterally, I feel a bit of fatigue in my skin sense. I am assuming a trend toward 4.0% after venting a little. Bonds tend to move straightforwardly. If the support line is broken, go with the flow.
If housing inventories released on the 21st show favorable conditions, it will likely give impetus to higher interest rates.
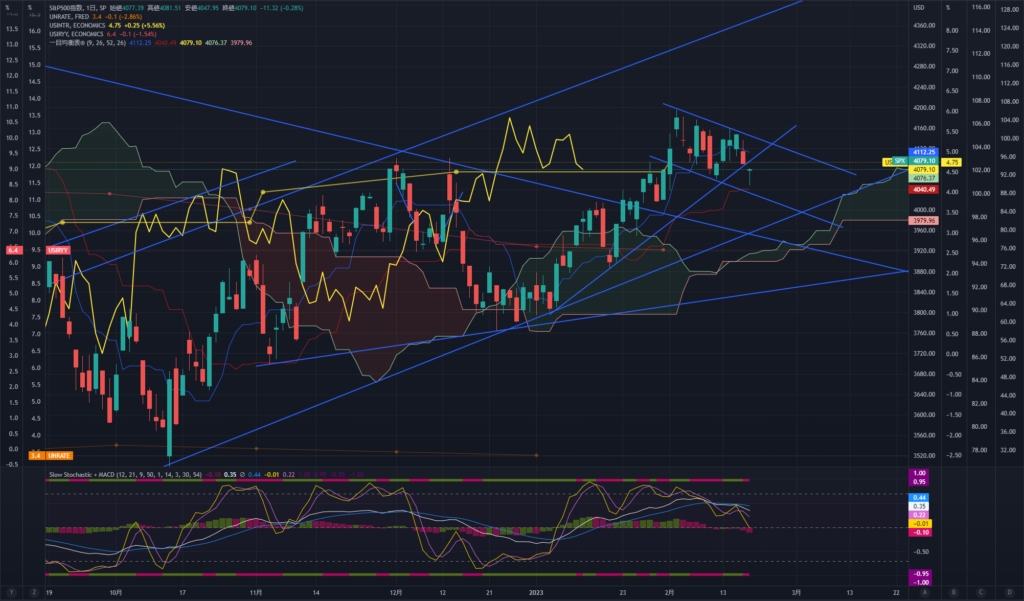
S&P500
Daily chart. We started lower on Friday with a window, but we could not fill this gap and closed it with a large lower mustache. I think it is better to wait for a move up to around 4,100 ~ 4,130 and then sell back down. We should be aware that a move above the previous week’s highs could give the rally some momentum. With rising interest rates and a stronger dollar trend, I believe that the SP500 has some path for a downtrend, but if you are looking for a full-blown crash, consider entering after the SVXY trend breaks down.
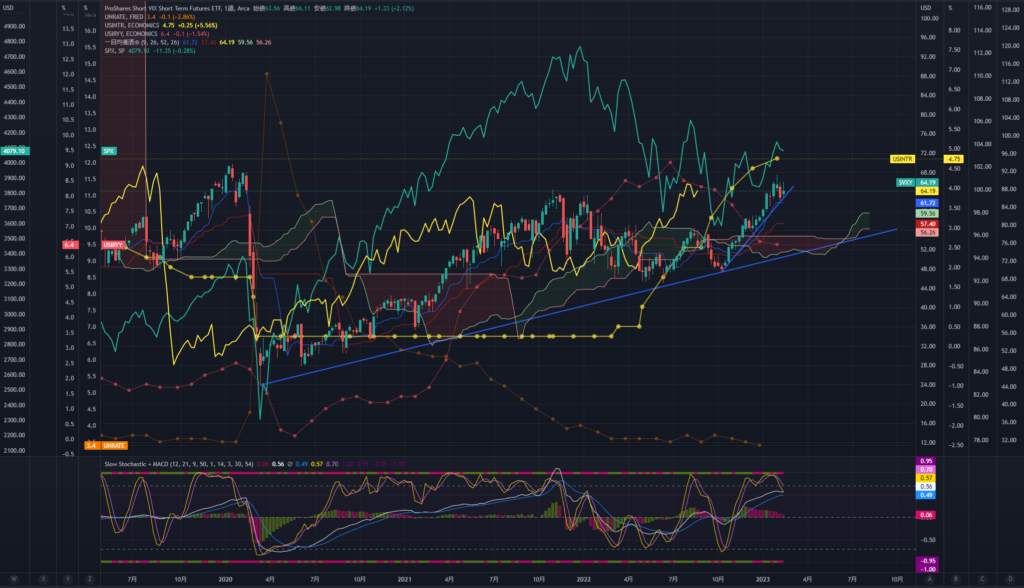
SVXY is a stock that shorts the VIX index. It has the characteristic of creating a gentle uptrend until a crash occurs.
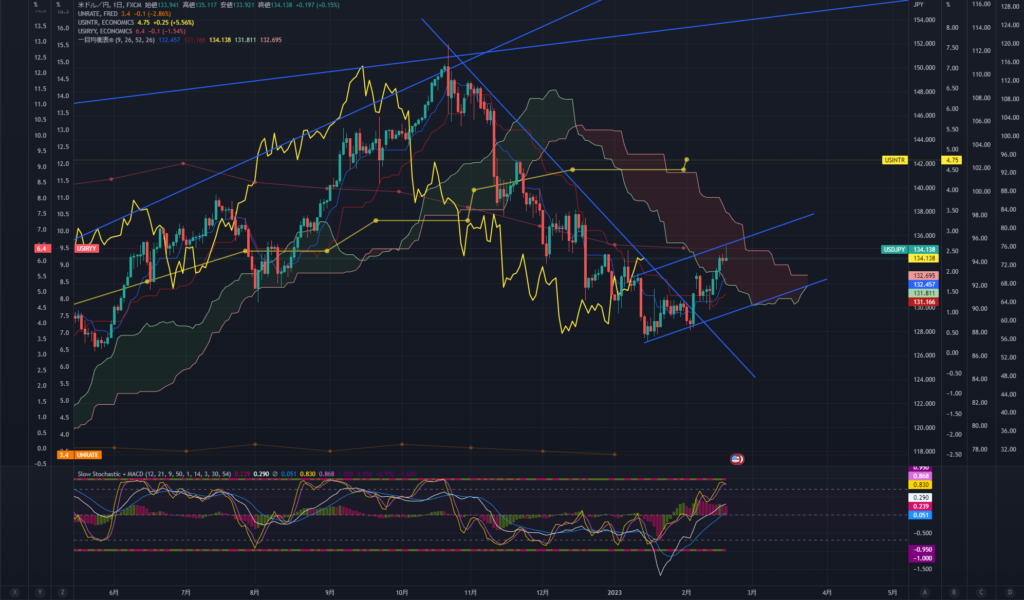
USD/JPY
Daily chart. It has risen nicely, as analyzed, but the slow stochastics are showing signs of overheating. This is also a reflection of the sharp rise in bond rates. We should expect a band walk to develop here to test the return. We know that the uptrend is continuing, but it is not a gung-ho one, so keeping an image of taking small, steady waves and repeating profit-taking is essential. Next week, I think it is good to keep a down eye on the market until we see rising interest rates regain momentum.
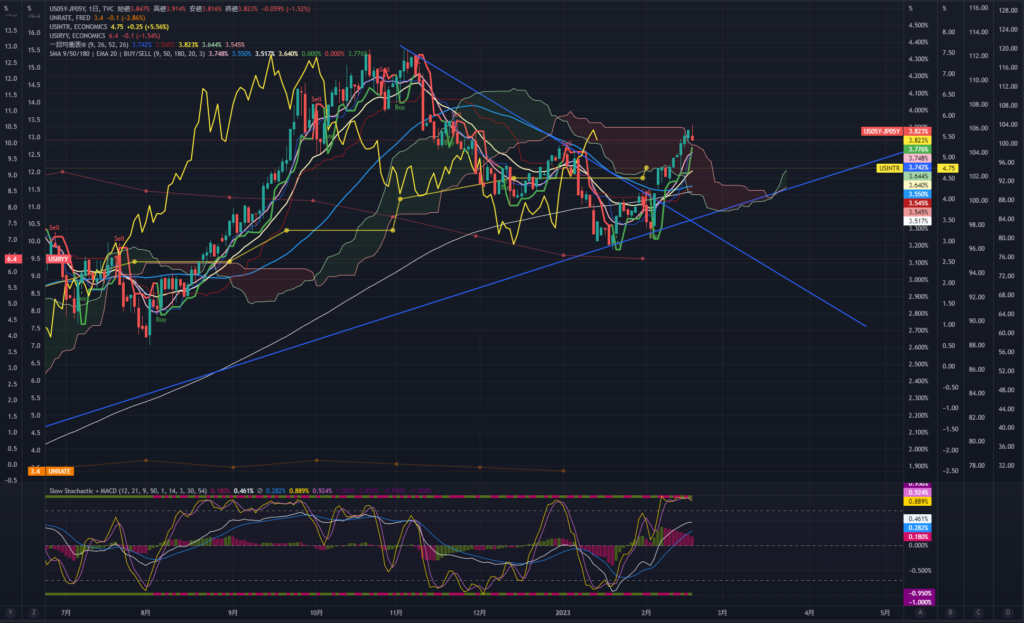
Japan-U.S. 5-year bond interest rate differential
Daily chart. We continue to judge the situation as a reversal of the trend of narrowing interest rate differential between the U.S. and Japan. The main scenario for next week is to test a slight knock. Still, for the direction of limiting interest rate differential to occur, the key will be “the forecast of the end of the Fed’s policy rate hike” or “the forecast of the start of the BOJ’s monetary tightening.” Until such specific materials emerge, I think there is no problem with the weaker yen scenario.
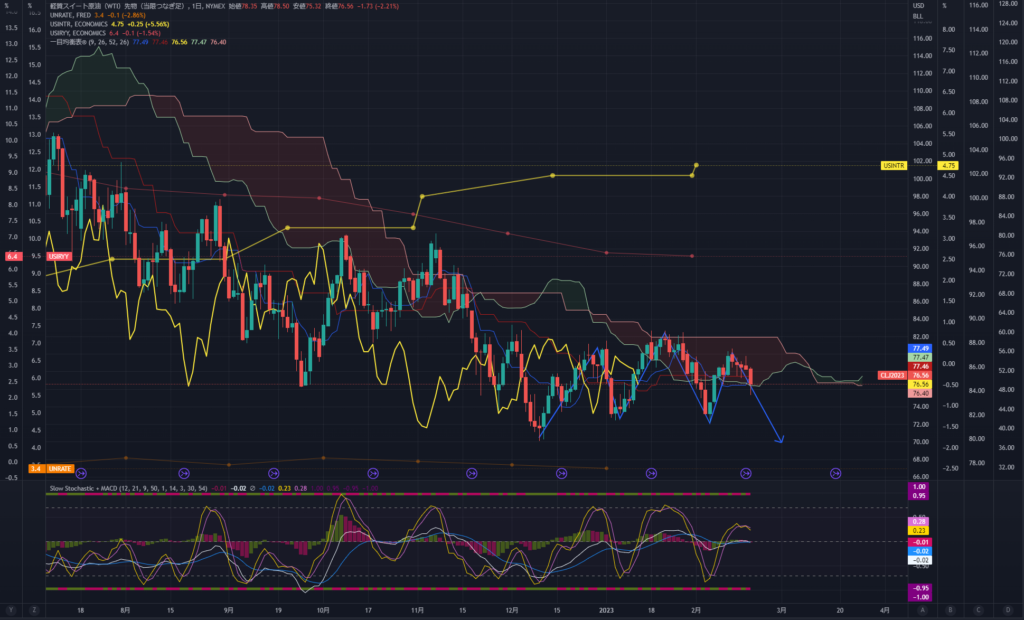
Crude Oil
The strong dollar limited the upside. There is an impression that the downward pressure will likely weaken a bit because the contango has been contracting for the past two weeks, and the interest rate hike is expected to be braked a bit next week. On the other hand, technical sell signs are also starting to appear, making it difficult to make a decision: a weekly cloud twist has been occurring since the first week of March, and the charts suggest that a significant trend is approaching (the main scenario is a sharp decline on the strength of the dollar). I think it is better to focus on stocks such as bonds as there are more accessible options in the short term. This is based on the idea that if the entry decision is a gamble, the exit decision will be more difficult. When trading, we recommend short-term trades using 30-minute charts or similar.
I am holding a long-term position to test the theory, but basically, my stance is to enter crude oil once in a while when I feel confident, take a small profit, and say goodbye.
Conclusion
This is another week to keep an eye on interest rates, but as in the past three weeks, it looks like it could be easy to get hurt if you are too hawkish about the one-sidedness of the market. I do not plan to trade immediately after the start of the week, but I will watch the trend of interest rates on long-term bonds and look for trading opportunities in TMV or SPXU.
I hope this post was helpful!
